Where community and environmental literacy come together:
Relax. Sit down. Enjoy. Connect.

April 21, 2014

What Does The Environment Do For Us?

A lot of people that I've talked to or overheard in conversation when talking about why the environment should be saved in a "wilderness" state often give the beauty of nature or the transcendental experience of being in a wilder setting as reasons.  Many find peace of mind, artistic inspiration and a sense of connectedness with the universe wandering in the great out-of-doors.  Some also note that you need to save wilderness areas to provide habitat for the animals and plants that call those places home.  If you lose those places you'll lose the animals and plants as well.


All of these reasons are good reasons to preserve our natural inheritance, but for people who are more business oriented or who don't enjoy nature that much might not be convinced that these reasons are sufficient to override the necessity for development and resource harvesting.

I was reading an interesting paper from BioScience journal called, "Linking Ecology and Economics for Ecosystem Management" that tried to take a more quantitative approach to valuing ecosystem services for the purpose of taking into account what monetary value is being lost by developing natural ecosystems.  

A satellite image of deforestation
At the most fundamental level humans and most other organisms (perhaps some bacteria are exceptions) could not survive long without the complex networks of services that we provide for one another.  All lifeforms are totally interdependent and are players in complex cycles where everything gets used and recycled.
 

Ecosystem services are all the benefits that humans obtain from ecosystems and the biosphere.  These services come in many forms and we'll go through many examples so that the next time someone, who maybe doesn't appreciate the beauty of nature, asks you why the environment should be preserved you'll be able to give some other, more utilitarian/anthropocentric, reasons.

Beyond beauty and the artistic/spiritual value of nature, and beyond the fact that many plants and animals call these wild places home, many people value nature for the purpose of all kinds of recreation from camping, hiking, canoeing, biking and other outdoor sports to photography, birdwatching, site-seeing, etc.  


At a more utilitarian level, we receive all of the necessities of life from the environment.  Everything we see in our homes and our communities came from the environment.  Perhaps it was metal ore from deep in the ground that was used to make railroad tracks, skyscrapers, bridges, machines, tools, parts in our cellphones and computers.  Perhaps it was coal, oil, or natural gas that now is being combusted to move our cars, trains, planes or to produce electricity.  Maybe it was wood cut down in the Pacific Northwest or the Amazonian Rainforest that is now our tables, desks, cupboards, bookshelves, doors or house-frames.  Maybe it was some plant harvested for food, drink, chemicals, lotion, medicine or fuel.  Maybe it was a medicinal herb that helps soothe a cold or a compound produced by a bacteria with anti-cancer properties.  Maybe it was some animal that was slaughtered for food, clothing, or apparel.  Everything comes from the environment whether near or far.  It can be fun to look at something like a computer and to try to deconstruct it down to its components and trying to guess where it all came from, how it was made, and who made it.

The provisioning of raw resources are more commonplace services that the environment provides, that many of us are aware of, though we may often forget them and take their complexity for granted (for instance, we might eat a cow, but what was necessary for that cow to survive?  It needed to eat grass, the grass needs sunlight, air, water, and good soil which requires bacteria and fungi which make nutrients accessible as well as worms that help nutrients cycle underground, and these worms, fungi and bacteria need things, etc.  It can get complex fast.), but there are other ecosystem services that many of us are not aware of though they are just as important, if not even more important.  

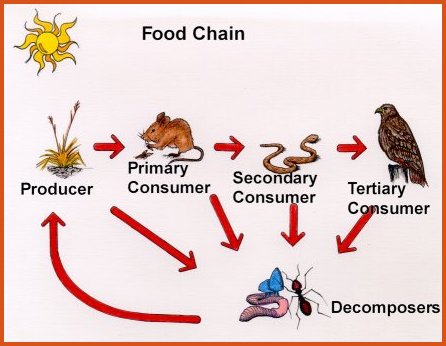
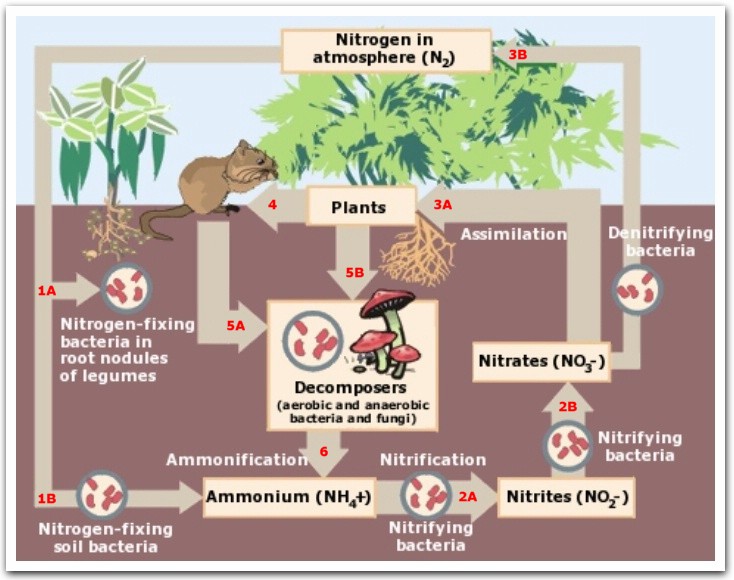
Nutrient cycling is one such extremely important, but ofter overlooked, ecosystem service that bacteria, fungi, protozoans, nematodes, and various other microorganisms as well as worms, and burrowing animals, etc., provide.  Nutrient cycling helps keep the soil fertile and often helps the soil retain moisture.  This is important for our crops as well as all plants which are the base of many food webs.  If nutrients didn't cycle, as a plant would grow its roots would deplete the soil in its vicinity.  The roots could grow longer to reach nutrients further and further away, but there is a limit to how long roots can grow.  The roots could also divide into a finer network to extract nutrients in the in-between places, but there is a limit to how finely divided a root system can become.  Thus, rather than the plant depleting its local area and eternally growing to reach nutrients further-and-further away, the nutrients come to the plant.  Bacteria and fungi make nutrients from atmospheric gases and transport those nutrients to plants in exchange for photosynthetically made sugars from the plant; worms and burrowing animals move nutrients from deeper levels to higher levels; decomposers breakdown dead organic matter into nutrients that the plant can use.  All of these processes make nutrients available to plants without the plant having to move or invest energy in growth.

 
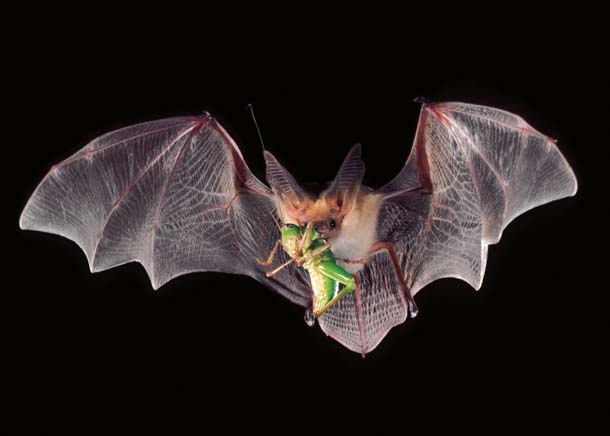
Pollination and seed dispersal are another important, but often overlooked ecosystem service.  According to the Natural Resources Defense Council approximately 30% of the world's crops are pollinated by bees alone.  Many plants require pollinators from bats and birds, to bees and butterflies to sexually reproduce.  Without this pollinator service many plants would soon die off and this would effect many other things like soil quality, climate, the gas composition of the atmosphere, and the number and kind of organisms that live off of plant matter in some way just to name a few.

Seed dispersion is necessary for many plants to increase their range size, to maintain genetic diversity, to increase the odds of rooting in fertile ground, to reduce local competition for resources, etc. and can be performed by insects, amphibians, reptiles, birds, and mammals including humans.


Climate Control, atmospheric regulation and the regulation of the hydrological cycle are yet another often overlooked ecosystem services provided by many organisms.  These services are perhaps provided more subtly and seem more abstract, but in the absence of a favorable climate, atmosphere and water cycle much of life on Earth would perish.  We all contribute to atmospheric regulation.  All organisms respire and produce CO2 or a CO2 equivalent (even plants produce some CO2).  Other organisms, like plants, algae and some bacteria make atmospheric oxygen out of CO2, while other bacteria make methane and nitrogen gas.  Just how the chemical composition of the atmosphere is maintained is still somewhat of a mystery, but we all contribute in some way and benefit too.

Organisms effect their climate.  Let's take a forest as an example.  A forest tends to be cooler and more humid than a city.  There is even some evidence that forests, because they are cooler and more humid, might generate some of their own rain in a way similar to "lake effect" precipitation.  Additionally, because forests retain moisture, they tend to help water percolate deep and recharge underground aquifers.  This process also helps purify water.  For all of these reasons when forests like the rain forests are clear-cut the land tends to become much drier and hotter, prone to desertification and fires.  Thus, many of the climates we enjoy on Earth might, in part, be created by the organisms around us and we would be wise to maintain them so that all of Earth doesn't become a harsh, hot, barren desert. 

Organisms who provide biological waste regulation services just like your local garbage collector tend to be under-acknowledged for their efforts.  Decomposers and nutrient recyclers are constantly at work.  Could you imagine living on an Earth where nothing dead ever broke down?  The Earth would be a heap of all the bodies of the plants, animals and microorganisms that ever lived with no room to live and with all the nutrients tied up.  Luckily, there are decomposers and recycling-minded organisms (like fungi and bacteria) who break down dead things into their elemental parts so that the nutrients can be re-used to make the bodies of organisms living, growing and still yet to be born.

Other organisms get rid of, detoxify or store our waste and pollution.  Wetlands are very good at removing pollutants, fertilizers, pesticides and other chemicals from rivers and lakes.  Other organisms help purify the air by removing pollutants and storing them in their bodies.  Many bacteria in the soil break down many human-made chemicals and remove molecules from water, in a purifying process, as it percolates to underground aquifers that we then can use as drinking water or irrigation water.

Other ecosystem services also go unnoticed like the disturbance mitigation wetlands and mangrove forests provide against flooding and tidal waves, or wind breaking by trees, or the prevention of landslides and erosion by the roots of plants. 

Biological regulation like pest control by predators is an important ecosystem service that we receive.  If there were no checks and balances on organisms like mosquitoes, termites, mice, bacteria, pathogens, etc., Earth would be a very different place (probably a very miserable one).  Biodiversity is one of the best protections against disease-causing organisms because it controls their populations and limits the extent of their range as well as provides competition for their niche.


The biological world also provides genetic resources which are important for resilience.  Diversity is necessary for life to survive a dynamic and sometimes harsh environment.  In agriculture, crosses are often made in the lab between ancestral corn plants and modern versions of corn when varieties need to be selected that can survive droughts better or that can survive the attacks of certain pests better, for example.  Lately, scientists have exploited the genetic diversity of bacterial toxins for crop production by putting those bacterial genes in corn and other crops as an insecticide.

Science and society also benefit from the intellectual ecosystem services of education and imagination.  Would we ever have thought of the possibility of flying had we not seen birds and insects flying?  Would we ever have developed anti-biotics had Alexander Flemming not noticed that a fungus was creating compounds that were keeping bacterial colonies at bay?  Will we develop renewable energy sources in the future mimicking the processes of photosynthesis?

For all of the ecosystem services that organisms on Earth provide for us how many more are provided that we're unaware of?  Is it possible that there are many other services provided that we're not aware of?  Is this reason enough to try and protect the biodiversity that exists on Earth?

The Earth and its organisms do so many things for us, to keep us alive, that we don't have to work or pay for.  These ecosystem services range from artistic inspiration and peace of mind, to water filtration, climate control, atmospheric chemistry regulation and the provisioning of food.  It can truly be said that we humans are totally dependent upon the organisms of this Earth for survival.  It's probably wise for us to keep that in mind as we go forward in this modern age.

-Seth Commichaux

April 8, 2014

Intergovernmental Panel on Climate Change: Blog Series Summary of 2014 Report

MY PURPOSE

Global Warming/Climate Change is a contentious issue of modern times, but too important of an issue, with implications for everyone on Earth, to ignore and for us to remain uninformed about the scientific evidence and predictions about its consequences for us and the rest of the biosphere.  The scientific literature is building and consensus about its reality, as well as the evidence that its major driver is human activity, is growing.  Between 1970 and 1990 less than 1,000 scientific articles, books and conference proceedings were published about climate change in English.  However, by the end of 2012 there were over 102,000 and the number is dramatically increasing as more and more people are affected and become aware of global warming/climate change.  When you include scientific articles from Africa, Asia, Latin America, Europe and Australia, the number is even greater. (2)

The Intergovernmental Panel on Climate Change (IPCC), a major organization founded by the United Nation's World Meteorological Organization (WMO) and the United Nations Environment Programme (UNEP), has recently released (March 31, 2014) one of the most comprehensive reports and analysis of climate change to date.  It also includes some of the most sophisticated, scientific models for predicting future outcomes of Global Warming/Climate change.  I've taken it upon myself to read as much of the IPCC report as I humanly can and to write a blog series summarizing and citing its findings to inform you about the current state of science on the issue of Global Warming/Climate Change.  It was reviewed by 1729 experts from 84 countries, had 436 contributing authors from 54 countries and over12,000 scientific references were cited.  The panel made a conscious effort to have a diverse and fair representation of authors and reviewers, both in terms of gender and national background, to minimize political, religious and cultural biases. (1)

SUMMARY AND CITINGS FROM IPCC REPORT (WORKING GROUP 2)

 CHAPTER 1. POINT OF DEPARTURE

"Warming of the climate system is unequivocal, and since the 1950s, many of the observed changes are unprecedented over decades to millennia.  Human influence on the climate system is clear; it has been detected in warming of the atmosphere and the ocean, in changes in the global water cycle, in reductions in snow and ice, in global mean sea level rise, and in changes in some climate extremes." (2)  I mention here also the acidification of the ocean and the detectable rise of greenhouse gases in the atmosphere such as carbon dioxide and methane that can be directly attributed to the combustion of fossil fuels.

It is likely that the global mean temperature will continue to rise throughout the 21st century and that the "length, frequency, and/or intensity of warm spells or heat waves will increase over most land areas."  "It is likely that the frequency of heavy precipitation will increase in the 21st century over many areas of the globe."  (2)

Figure 1.  Showing the strong correlation between mean global temperature and atmospheric carbon dioxide increase
 

Figure 2. The periodic oscillations of carbon dioxide over the past 400,000 years and the uncharacteristic spike who's beginning strongly correlates with the beginning of the industrial revolution.
Three goals of the Working Group (WG) who wrote the IPCC report:
1) Detect and identify impacts of climate change
2) Identify what of climate change can be attributed to human activity
3) Predict and project effects of climate change into the 21st century

"As basic resources such as energy, land, food or water become threatened, inequalities and unfairness may deepen leading to maladaptation and new forms of vulnerability.  Responses to climate change may have consequences and outcomes that favor certain populations or regions.  For example, there are increasing cases of land-grabbing and large acquisitions of land or water rights for industrial agriculture, mitigation projects or biofuels that have negative consequences on local and marginalized communities." (2)

• Risks to Unique and Threatened Systems: biodiversity and many ecosystems such as polar and high mountain communities are at increased risk of adverse impacts from temperatures increase
• Risks Associated with Extreme Weather Events:  projected increases in droughts, heat waves, extreme high-water coastal events, a rise in sea-levels and floods, as well as their adverse impacts.
• Risks Associated with the Distribution of Impacts: “There are sharp differences across regions and those in the weakest economic position are often the most vulnerable to climate change."  However, the poor and elderly are vulnerable groups in developed and developing countries alike.
• Risks Associated with Aggregate Impacts: Whatever benefits come from less-severe winters and cold-spells will be dwarfed by the negative costs of excessive heat and more severe weather patterns.

Even if we adjust our behavior now we will not be able to avoid further impacts of climate change for decades to come, but if we don't adjust our behavior the magnitude of effects caused by climate change will likely make "adaptation impossible for some natural systems;" while humanity will likely suffer "very high social and economic costs." (2)

"the deployment of renewable energy technologies has increased rapidly in recent years, often associated with cost reductions that are expected to continue with advancing technology. Despite the small contribution of renewable energy to current energy supplies.....the global potential of renewable energy...(is)...substantially higher than the global energy demand. It is therefore not the technological potential of renewable energy that constrains its development, but rather economic factors, system integration, constraints, public acceptance, and sustainability concerns." (2)

"Economic losses from weather- and climate-related disasters have increased, but with large spatial and (temporal) variability."  Disaster losses, fatality rates and economic losses due to climate related events are higher in developing countries.  "From 1970-2008....more than 95% of deaths from natural disasters were in developing countries."  "environmental degradation, unplanned urbanization, failure of governance or reduction of livelihood options result in increased exposure and vulnerability to disasters."  "improvements in governance and technology...(and)...more transformational changes are essential for reducing risk from climate extremes." (2)

SCIENTIFIC INFORMATION CITED FROM CHAPTER 1. POINT OF DEPARTURE

Greenhouse gases and climate forcing:

"Human activities are the dominant cause of the observed increase in well mixed greenhouse gases (GHGs) since 1750 and of the consequent increase in climate forcing." (2)
  1. GHGs have continued to increase and at an accelerated rate since 1970. 
  2. Present-day (2011) abundances of CO2, CH4, and N2O exceed the range over the past
    800,000 years found in ice cores.
  3. Annual emission of CO2 from fossil fuels and cement production was 9.5 GtC in 2011, 54% above the 1990 level.
  4. More than 20% of added CO2 will remain in the atmosphere for longer than 1000 years.
  5. Cumulative CO2 emissions from 1750 to 2011 are 365 GtC (fossil fuel and cement) plus 180 GtC (deforestation and other land-use change). This 545 GtC represents about half of the 1000 GtC total that can be emitted and still keep global warming under 2 °C relative to the reference period 1861-1880.
  6. ***In 2010, GHG emissions surpassed 50 Gt CO2-eq (13.6 GtC), higher than in any previous year  since 1750. Most of the emission growth between 2000 and 2010 came from fossil-fuel use in the energy and industry sectors, and took place in emerging economies. This emission growth  was not met by significant GHG emission cuts in the industrialized country group, which continued to dominate historical long-term contributions to global CO2 emissions. In 2010,  median per capita GHG emissions in high income countries were roughly ten times higher than in low-income countries.***
Surface Temperatures:
  1. Global mean surface temperature increased by 0.85 [0.65 to 1.06] °C over the period 1880–
    2012 (linear trend) and by 0.72°C over the period 1951–2012. Each of the last three decades (from 1983 to 2012) has been successively warmer than any preceding decade since 1850. 
  2. More than half of the 1951-2010 temperature increase is due to the observed
    anthropogenic increase in GHG (Greenhouse Gases).
  3. The projected near term (2016-2035) mean surface temperature increase is 0.9–1.3 °C, and the long term (2081-2100) ranges from 0.9–2.3 °C to 3.2–5.4 °C.
  4. Global temperatures during the last interglacial period (~120,000 years ago) were never more than 2°C higher than pre-industrial levels. By 2050 the global warming range is 1.5°C to 2.3°C above the 1850-1900 period based on the range across all...models.
Precipitation:
  1. Precipitation (global annual averages) will increase as temperatures increase, and the contrast between dry and wet regions and that between wet and dry seasons will increase over most of the globe.
  2. High latitudes will experience more precipitation;many moist mid latitude regions will also experience more; while many mid latitude and subtropical arid and semiarid regions will experience less.
  Extreme temperatures and precipitation:
  1. Extreme high temperatures (20-year return values) are projected to increase at a rate similar to or greater than the rate of increase of summer mean temperatures in most regions.
  2. In the long term heat waves will occur at higher frequency and longer duration in response to increased seasonal mean temperatures.
  3. With global warming, the frequency and intensity of heavy/extreme precipitation events will increase over most mid latitude land and over wet tropical regions.
Floods and droughts:
  1. In many regions, historical droughts (last 1000 years) and historical floods (last 500 years)
    have been more severe than those observed since 1900.
  2. The frequency and intensity of drought has increased in the Mediterranean and West Africa, and it has decreased in central North America and north-west Australia since 1950.
  3. There is low confidence in attributing drought changes to human influence.
Tropical cyclones, storms, and wave heights:
  1. The frequency and intensity of the strongest tropical cyclones in the North Atlantic has increased since the 1970s.
  2. The maximum wind speed and precipitation rates of tropical cyclones will increase.
  3. Circulation features have moved poleward since the 1970s, including a poleward shift of storm tracks and jet streams.
  4. With global warming, a shift to more intense individual storms and fewer weak storms is projected.
  5. Mean significant wave height has increased over much of the Atlantic north of 45°N since 1950, with winter season trends of up to 20 cm/decade.
  6. Wave heights and the duration of the wave season will increase in the Arctic Ocean as a result of reduced sea-ice extent. Wave heights will increase in the Southern Ocean as a result of enhanced wind speeds.
Ocean warming, stratification and circulation:
  1. Overall, the ocean has warmed throughout most of its depth over some periods since 1950, and this warming accounts for about 93% of the increase in Earth's energy inventory between 1971 and 2010.
  2. The upper ocean above 700 m has warmed from 1971 to 2010, and the thermal stratification has increased by about 4% above 200 m depth.  Anthropogenic forcings have made a substantial contribution to this upper ocean warming.
  3. To date there is no observational evidence of a long-term trend in Atlantic Meridional  Overturning Circulation; and over the 21st century it is projected to weaken but not undergo an abrupt transition or collapse.
Ocean acidification and low-oxygen:
  1. Oceanic uptake of anthropogenic CO2 results in gradual acidification of the ocean. Since 1750 the pH of seawater has decreased by 0.1 (a 26% increase in hydrogen ion concentration).
  2. Aragonite under-saturation becomes widespread in parts of the Arctic and Southern Oceans and in some coastal upwelling systems at atmospheric CO2 levels of 500–600 ppm.  (This means that many shellfish's shells (such as mollusks) as well as coral's will dissolve in the acidity of the ocean.)
  3. Oxygen concentrations have decreased since the 1960s in the open ocean thermocline of many regions. By 2100, the oxygen content of the ocean will decrease by a few percent.  (This could cause the suffocation of many lifeforms who separate oxygen from the water when they respire underwater.)
Figure 3. A coral on a beach
Sea ice:
  1. The annual Arctic sea ice extent decreased at a rate of 3.5 to 4.1% per decade between 1979 and 2012.  The average Arctic winter sea ice thickness decreased between 1980 and 2008.
  2. Over the past three decades, Arctic summer sea ice retreat was unprecedented and Arctic sea surface temperatures were anomalously high, compared with the last 1,450 years.
  3. With global warming, further shrinking and thinning of Arctic sea ice cover is projected, and the Arctic Ocean will be nearly ice-free in September before 2050 for the high-warming scenarios.
  4. Annual Antarctic sea ice extent increased by 1.2 to 1.8 % per decade between 1979 and 2012.  The scientific understanding of this observed increase has low confidence. With global  warming, Antarctic sea ice extent and volume is expected to decrease (low confidence).
Ice sheets, glaciers, snow cover and permafrost:
  1. During periods over the past few million years that were globally warmer than present, the Greenland and West Antarctic Ice Sheets were smaller.
  2. The Antarctic and Greenland Ice Sheets have on average lost ice during the last two decades,  and the rate of loss has increased over the most recent decade to a sea-level rise equivalent of 0.6 mm/y for Greenland and 0.4 mm/yr for Antarctica.
  3. Almost all glaciers world-wide have continued to shrink since the mid-20th century.  
  4. Over the last decade, most ice was lost from glaciers in Alaska, Canadian Arctic, Greenland Ice Sheet periphery, Southern Andes, and Asian Mountains.  Current glacier extents are out of  balance with current climate, and glaciers will continue to shrink even without further warming.
  5. Snow cover extent has decreased in the Northern Hemisphere, particularly in spring.
  6. Permafrost temperatures have increased in most regions since the early 1980s: observed  warming was up to 3°C in parts of Northern Alaska and 2°C in parts of the Russian European North.
Sea level rise:
  1. During the last interglacial period, when global mean temperatures were no more than 2°C  above preindustrial values (medium confidence), maximum global mean sea level was, for  several thousand years, 5 m to 10 m with substantial contributions from Greenland and Antarctic Ice Sheets.
  2. The rate of sea level rise since the mid-19th century has been larger than the mean rate during the previous two millennia.
  3. Global mean sea level has risen at an average rate of 1.7 mm/yr from 1901 to 2010 and at a faster rate, 3.2 mm/yr, from 1993 to 2010 (this current rate is approximately 1.26 inches/decade).
  4. If global warming exceeds a certain threshold resulting in near-complete loss of the Greenland Ice Sheet over a millennium or more (confidence not assessed), global mean sea level would rise about 7 m.
  5. The magnitude of extreme high sea level events has increased since 1970. Future sea level  extremes will become more frequent beyond 2050, primarily as a result of increasing mean sea level.
Climate patterns:
  1. Models project an eastward shift of El Niño temperature and  precipitation variations over the North Pacific and North America. El Niño remains the dominant mode of inter-annual climate variability in the future, and the El Niño precipitation anomalies will intensify due to increased moisture.
  2. Monsoon onset dates become earlier or do not change and monsoon retreat dates delay,  lengthening the monsoon season. Reduced warming and decreased precipitation is projected in the eastern tropical Indian Ocean, with increased warming and precipitation in the western, influencing East Africa and Southeast Asia precipitation.
CONCLUSION

"A continuation of current trends of technological change in the absence of explicit climate change mitigation policies is not sufficient to bring about stabilization of greenhouse gases. Scenarios, which are more likely than not, to limit temperature increase to 2° C are becoming increasingly challenging." (2)

Sources Cited:

1) http://ipcc-wg2.gov/AR5/images/uploads/IPCC_WG2AR5_FactSheet.pdf
2) The IPCC's WG II 5th assessment report on climate change (March 31, 2014)
http://ipcc-wg2.gov/AR5/images/uploads/WGIIAR5-Chap1_FGDall.pdf

-Seth Commichaux